
1. From the active record, select the client you want.
2. Click on the Medical tab.
3. Click on the Graphs button on the Medical page. See Module 3: Figure 50 below.
Note: The Prenatal Weight Gain graphs available in HANDS include Normal, Obese, Overweight, and Underweight. HANDS will populate the appropriate Prenatal Weight Gain graph based on the woman's BMI and if she is pregnant with a single baby or multiple.

Module 3: Figure 39: Graphs
4. Select the Graph Type from the drop-down list and click View Graph. The graph will display. See Module 3: Figure 40 below.


Module 3: Figure 40: Graph Display
The graph will display. See Module 3: Figure 41 below.

Module 3: Figure 41: Graph
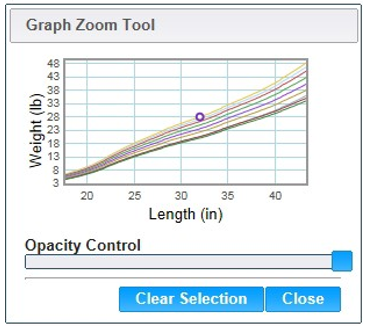
5. To zoom in on the data in the graph click the Zoom Tool button. The Zoom Tool displays. See Module 3: Figure 42 below.

Module 3: Figure 42: Graph Zoom Tool
6. Highlight the area you want to zoom by clicking and dragging the mouse, which will display the highlighted area in the main graph. See Module 3: Figure 43 below.

Module 3: Figure 43: Zoomed In Graph
7. Click the Close button to close the Graph Zoom Tool.
8. Click the Print button to print the graph that is displayed on the page.
Remember: If the graph is zoomed in the zoomed in view will be the one that is printed.
9. Click the Reset Graph button to set the graph back to its original view.
10. You can select another graph from the drop-down list to view or click the Medical button to return to the Medical page.